

What is a Gantt chart?
The Gantt chart is one of the most important project management tools available these days. A Gantt chart is a popular and very useful way of showing activities, tasks or events of a certain project displayed against time. On the vertical axis is the list of activities that need to be completed and on the horizontal is the project timeline. Each timeframe is adjacent to the activity that it is referring to. Each activity is represented by a bar on the Gantt chart. The position and length of the bar represent the start date, duration and the end date of the activity.
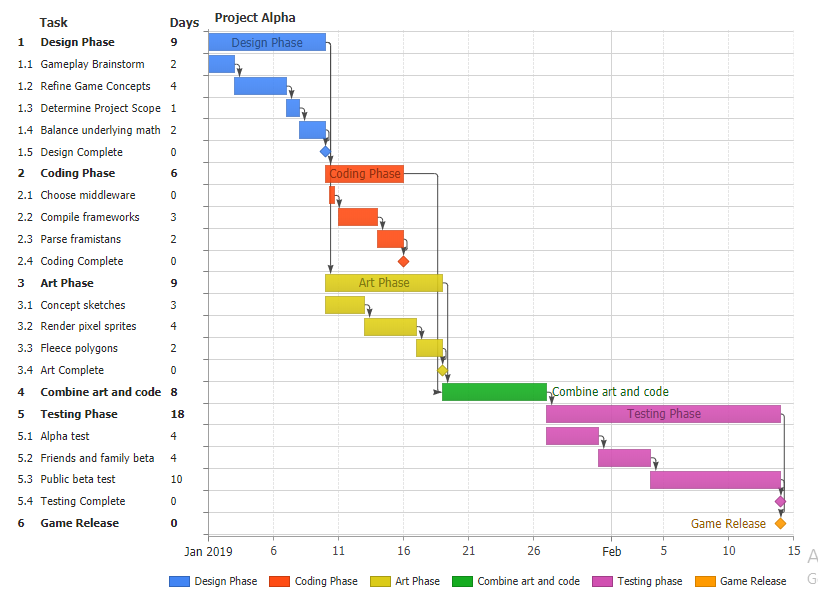
The above-given charts allow us to see various important features of the project activities at a glance. These features include:
- List of all activities, or project tasks, that make up the whole project
- The specific task names
- The starting date of each activity
- How long a particular activity is scheduled to last
- The ending date of each activity
- Are there any activities that overlap
- Task dependencies (one task must be completed before the next can begin)
- The starting and ending of the whole project
- The project schedule
History of the Gantt chart
The first Gantt chart was devised by Karol Adamiecki, in the 1890s. Karol was a Polish engineer who ran steelworks and became interested in management ideas and techniques. At that time the Gantt chart did not have its name.
Later in the early 1900s, an American engineer and a management consultant named Henry Gantt devised a different version of the same chart and it was him who the name was to become associated with charts of this type.
In the early days, Gantt charts were created by hand and they took a lot of effort, and if a project got delayed, or extended, the chart had to be drawn all over again. Things became easier with the advent of computers and different project management software tools, which help us create, update and print Gantt charts easily.
Different uses of Gantt charts
From the early days till now Gantt charts have continued to exist in many forms. From good old fashioned paper to desktop applications and now web-based software, Gantt charts have always had countless applications. Bringing these charts online transformed them from a static document that quickly becomes obsolete to a living, collaborative representation of an entire project’s current state.
Gantt charts are being used in every industry. A few examples of the types of teams and companies that use Gantt charts to plan, schedule, and execute their projects are:
Construction

Gantt charts can help people in the construction business keep track of their construction projects, subcontractors and job hours, etc. Modern Gantt chart software applications help load job schedules in minutes and provide all the project updates in real-time so contractors can focus on the job instead of getting stuck on the planning part.
Consulting agencies

Consulting agencies have great applications for Gantt charts. Top management can easily analyze the progress of their teams and see what their team and resources are working on at a particular time, or what they have planned for the future. Seeing the whole picture allows you to make changes on the fly to keep projects moving along efficiently.
Marketing teams

With so many moving parts, marketers need to quickly see all of their tasks in one place and pinpoint exactly what they need to work on today to meet their due dates. A marketing manager also needs to see all the tasks their team is working on. Gantt charts help them see all the resource information across all their active projects, ensuring no person or team gets overextended and assigned too much work.
Human Resources

Gantt charts are an easy solution to the thorny tasks that torment HR managers on a daily basis. In HR, there are a lot of responsibilities that fall on the shoulders of an HR manager, these include, planning, directing, coordinating, hiring, firing, interviewing and consulting with other people. Project management in human resources is no picnic and use of Gantt charts can simplify it to a great extent by plotting all the activities on a timeline so there are no surprises.
Event Planning

The most important use of Gantt charts is in event planning. Event planning project management can become unconquerable mountains unless broken down into small tasks and milestones. With the help of Gantt charts, you can easily schedule these milestones and any important tasks that need to be completed before a certain deadline in order to plan the event properly.
Creating Gantt Charts
While it is possible for project managers to create Gantt charts in generalized software such as Microsoft Excel, or even emulate Gantt charts with bar charts with ranges defining a start date and end date, advanced implementation requires dedicated software with a specific Gantt type. You can then use features such as Gantt dependencies, milestones and more. Desktop solutions such as Microsoft Project have specific tools to help managed complicated projects and collaborate with large teams. Server-side software and client-side products such as JavaScript Gantt charts can be integrated seamlessly into your own website and SaaS-based solutions are ready to run without any installation or customization of software.
Gantt Dependencies
Some project tasks depend on other tasks to be finished before they can begin. Dependencies are visualized with a line and arrow going from the parent task to the dependent task. This parent-child hierarchy is referred to as Gantt dependencies when used with Gantt charts. There are different kinds of dependencies but the most common is the finish-to-start dependency. Gantt dependencies are also a key element in critical path analysis.

Milestones
Milestones signify a point in time most often used to show when a group of tasks has been completed. Rather than showing as a horizontal bar with a start and end date, milestones are usually shown as a shape such as a diamond with only a single date. In other words, milestones are tasks with no duration.

Conclusion
Gantt charts are ideal project management tools that excel at the visual representation of task hierarchies and communicate real-time progress to project managers and team members alike. From the first task to the last, Gantt charts offer step-by-step overviews that keep projects on schedule regardless of the industry you are working in.
This article is contributed by JSCharting.