


What is a dashboard?
The first thing that may come to your mind will be what you usually see in your vehicle just above the steering. However, that isn’t the type of dashboard being referred to here. We are referring to dashboards used by different kinds of businesses and industries for data visualization.
Dashboards display metrics which are very important in helping us understand particular areas of interest. A good dashboard has the ability to give you an understanding of events at a glance. A dashboard is characterized as a timesaver based on the fact that it displays vital information efficiently.
Dashboards should not be mistaken for reports
Most people mistake dashboards for reports, and this is a very big misconception. They see a dashboard as a report because it is displaying the info being reported on. A report is a one-time thing, can be long, and can require a lot of time to put together.
Dashboards, however, are tools for connecting to info. Unlike reports, dashboards change as the information changes in real-time. Dashboards can be used to dive into reports and extract vital information in details.

Dashboards are created for the representation of data as well as causal relationships which are already known in order to enhance monitoring seamlessly with little or no effort. A dashboard is usually displayed on a purpose-built screen and basically contains just essential data which is needed for the achievement of organizational goals as well as providing solutions to problems faced by the intended user. Dashboards are built to give you the ability to quickly monitor critical information in just a single glance. It offers sufficient contextual and analytical detail and gives you a quick way of extracting the relevant details.
This means that dashboard effectiveness relies on the quality of its design and how that design connects with the intended audience. You will find dashboards being more interactive today. However, its effectiveness is mostly determined by the level of time and work needed to get insights.
Dashboard visuals by chart types
Different kinds of visuals can be used on dashboards. The truth is that your dashboard can contain anything you want it to. The dashboard might even come with a video. Check out these two usual suspects that may be seen on typical dashboards:
Gauges
Gauges are one of the visuals used when it comes to data visualization and dashboards. When you think of a dashboard, this is one of the first visuals that come into your mind. Gauges are basically utilized to display actual vs. Performance targets.

Sparklines
In contrast with gauges, sparklines happen to be mostly preferred by data visualization professionals. Sparklines are basically small line charts and are used in displaying trends over time. Sparklines have certain features which make them highly desired by the experts. One of the reasons is that they are very good at saving space. Another reason is that they can be used to tell a story which gives the viewer a context that is very useful. They are data-intense, small sized graphics that come in a simple design. If you are looking to show data over a period of time, a sparkline can be a perfect visual. You might wonder why sparklines come in handy for designing dashboards.
The reason is that this visualization element has the ability to save both space and time. A lot of data can be packed into such small space with the addition of vital contextual info. They, therefore, provide a quick understanding of events at just a simple glance. This makes it easier to identify issues to be addressed as well as actions to be implemented.
Dashboard Technical Implementation (looking under the covers)
Just how does a great dashboard design idea get realized in your web application? That is where a program or data visualization expert comes in to take your functional requirements and needs and translate them using a charting library or dashboard framework. They will be sure to consider a responsive design so your dashboard looks as good on mobile devices and phones as it does on desktops, laptops, and tablets. They can select javascript chart tools using SVG or scalable vector graphics with HTML5 to ensure the charts on your dashboards are crisp and clear even when zooming or printing. Data will be loaded from your databases and other sources and passes to your dashboard page through JSON (JavaScript Object Notation) which is a lightweight data-interchange format.
Conclusion
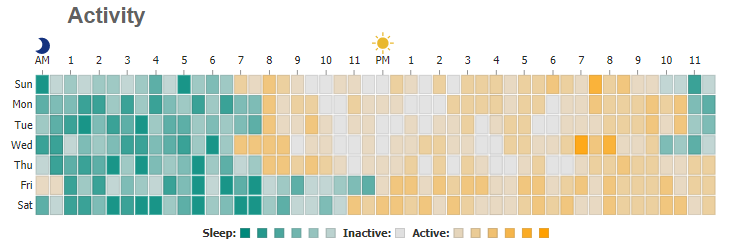
Whatever the technical tools used, the end result must be a dashboard that works for you and your customers that will help convey key metrics about your business quickly and efficiently. With an efficient modular design, you will be able to update and customize your dashboard as your business and needs grow so it can be an asset for years to come.
This article is contributed by JSCharting.

